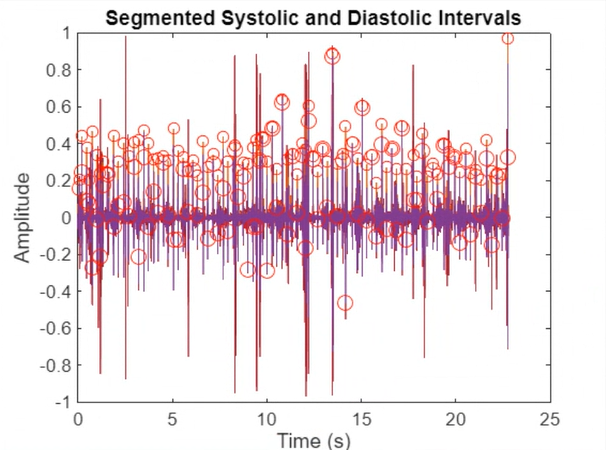
The systolic and diastolic intervals of the acquired heart sound are identified by segmenting the signal between detected peaks, corresponding to the S1 and S2 sounds. In this project, the heart cycle is divided into alternating systolic (contraction phase) and diastolic (relaxation phase) intervals using peak detection. The S1 to S2 interval is classified as systole, representing the period when the heart pumps blood through the arteries. The S2 to the next S1 interval is classified as diastole, where the heart refills with blood. The provided code iterates through the detected peak locations (
locs), and based on their order, alternates between identifying systolic and diastolic phases. Odd-indexed intervals correspond to systole, while even-indexed ones indicate diastole, ensuring that each complete heart cycle is captured accurately. This segmentation is crucial for further analysis, such as detecting murmurs or abnormal rhythms that may appear during specific phases.MATLAB CODE

WAVEFORM
RESULTS
Systole from 0.0865 to 0.222
Diastole from 0.222 to 0.46725
Systole from 0.46725 to 0.61875
Diastole from 0.61875 to 0.7595
Systole from 0.7595 to 0.999
Diastole from 0.999 to 1.1878
Systole from 1.1878 to 1.3217
Diastole from 1.3217 to 1.5665
Systole from 1.5665 to 1.8887


No comments:
Post a Comment