VITAL TECH
A biomedical blog where we share research, project ideas, and findings. Currently focusing on heart murmur detection and its technologies.
Monday, 14 October 2024
HEART MURMUR DETECTION AND CLASSIFICATION
MURMUR DETECTION
The MATLAB code provided for murmur detection and classification focuses on identifying intervals in the heart cycle where murmurs may occur, specifically during systole (S1 to S2) and diastole (S2 to the next S1). By segmenting the heart sound signal into these intervals, the code isolates potential murmur segments for further analysis. These segments can then be examined for specific acoustic characteristics, such as abnormal frequency content, duration, or irregular patterns. This approach helps in classifying murmurs based on the timing of their occurrence and their distinguishing features, aiding in the diagnosis of conditions like stenosis or regurgitation.
MATLAB CODE
RESULTS
Systole from 1.1878 to 1.3217
Diastole from 1.3217 to 1.5665
Systole from 1.5665 to 1.8887
Diastole from 1.8887 to 2.1285
Systole from 2.1285 to 2.4325
Diastole from 2.4325 to 2.6775
Systole from 2.6775 to 2.9598
Diastole from 2.9598 to 3.2058
Systole from 3.2058 to 3.4958
Diastole from 3.4958 to 3.7363
ANALYSING MURMUR FEATURES
The MATLAB code for analyzing murmur features calculates the duration of a murmur by measuring the time between consecutive heart sound peaks, either from S1 to S2 (systole) or from S2 to the next S1 (diastole). This murmur duration provides crucial insight into the nature of the heart murmur, as certain conditions, such as stenosis or valve insufficiency, manifest through prolonged or abnormal murmur durations. By displaying the murmur duration in seconds, the code helps in quantifying the murmur's temporal characteristics, which is vital for distinguishing between different types of murmurs and assessing their severity.
MATLAB CODE
MATLAB CODE
RESULTS
Systole from 1.1878 to 1.3217
Diastole from 1.3217 to 1.5665
Systole from 1.5665 to 1.8887
Diastole from 1.8887 to 2.1285
Systole from 2.1285 to 2.4325
Diastole from 2.4325 to 2.6775
Systole from 2.6775 to 2.9598
Diastole from 2.9598 to 3.2058
Systole from 3.2058 to 3.4958
Diastole from 3.4958 to 3.7363
ANALYSING MURMUR FEATURES
The MATLAB code for analyzing murmur features calculates the duration of a murmur by measuring the time between consecutive heart sound peaks, either from S1 to S2 (systole) or from S2 to the next S1 (diastole). This murmur duration provides crucial insight into the nature of the heart murmur, as certain conditions, such as stenosis or valve insufficiency, manifest through prolonged or abnormal murmur durations. By displaying the murmur duration in seconds, the code helps in quantifying the murmur's temporal characteristics, which is vital for distinguishing between different types of murmurs and assessing their severity.
MATLAB CODE
HEART RATE ESTIMATION
The MATLAB code provided estimates the heart rate by calculating the time intervals between detected heart sound peaks, such as S1 and S2. First, the time difference between consecutive peaks (systolic and diastolic intervals) is computed, and the average of these intervals gives the average beat interval. The heart rate is then estimated by dividing 60 by the average beat interval, which converts the time in seconds to beats per minute (BPM). This simple yet effective approach provides an accurate heart rate estimate based on the cyclical nature of the heart's acoustic signals, offering valuable insights into cardiac rhythm.
MATLAB CODE
RESULT
ESTIMATED HEART RATE = 52.6 BPM
ESTIMATED HEART SOUND WITH DETECTED PEAKS
MATLAB CODE
WAVEFORM
SHORT-TIME FOURIER TRANSFORM
stft (audio_filtered, Fs, 'Window', hamming(256), 'Overlap Length', 128)
, the filtered heart audio signal is divided into overlapping segments, with each segment transformed into the frequency domain. A Hamming window of size 256 is used to minimize spectral leakage, and an overlap of 128 samples ensures smooth transitions between segments. This time-frequency analysis is essential for identifying abnormalities such as murmurs, which may manifest as unusual frequency components during specific phases of the heart cycle. STFT provides a spectrogram, allowing visualization of frequency variations over time, making it a powerful tool for diagnosing heart conditions.MATLAB CODE
WAVEFORM
SYSTOLIC AND DIASTOLIC INTERVALS
locs
), and based on their order, alternates between identifying systolic and diastolic phases. Odd-indexed intervals correspond to systole, while even-indexed ones indicate diastole, ensuring that each complete heart cycle is captured accurately. This segmentation is crucial for further analysis, such as detecting murmurs or abnormal rhythms that may appear during specific phases.MATLAB CODE

WAVEFORM
RESULTS
Systole from 0.0865 to 0.222
Diastole from 0.222 to 0.46725
Systole from 0.46725 to 0.61875
Diastole from 0.61875 to 0.7595
Systole from 0.7595 to 0.999
Diastole from 0.999 to 1.1878
Systole from 1.1878 to 1.3217
Diastole from 1.3217 to 1.5665
Systole from 1.5665 to 1.8887
VISUALISATION OF HEART SOUND
HEART SOUND ACQUISITION
Heart sound acquisition refers to the process of recording the sounds produced by the heart during its regular operation. These sounds, known as heartbeats, typically consist of two distinct tones: the lub (S1) and dub (S2), which correspond to the closing of heart valves. These sounds are crucial for assessing heart function and diagnosing various cardiac conditions such as murmurs, arrhythmias, and other abnormalities.
WHY HEART SOUND ACQUISITION MATTERS ?
Heart sound acquisition is the first step in analyzing heart function. Without clear, high-quality recordings, it becomes difficult to detect subtle abnormalities that may indicate early signs of heart disease. By capturing these sounds electronically, it is possible to analyze them using advanced algorithms, helping to detect issues that might be missed during a manual check-up with a traditional stethoscope.
MATLAB CODE
WAVE FORM
SEGMENTATION OF HEART SOUNDS
SEGMENTED HEART SOUNDS - S1, S2 PEAKS
In this step, the filtered heart sound signal is further analyzed by marking and segmenting key components, specifically the S1 and S2 heart sounds. The filtered audio is plotted over time, and the identified peak locations (representing S1 and S2 sounds) are highlighted with red circles for clarity. These peaks are marked using the coordinates derived from the previous peak detection process, allowing us to visually pinpoint the occurrence of the S1 and S2 sounds within the heart cycle. The labeled peaks provide critical insight into the timing and structure of heart sounds, aiding in the segmentation of the signal into individual heartbeats. This segmentation is essential for further analysis, such as determining the intervals between heart sounds or detecting abnormal heart patterns like murmurs.
MATLAB CODE
PEAK DETECTION
In this stage of heart sound analysis, peak detection is performed on the envelope of the filtered heart sound signal. The find peaks
function is used to identify significant peaks in the envelope, which correspond to key features of the heart sound, such as the S1 and S2 heart sounds or potential murmur events. The peaks are detected based on a minimum peak height of 0.1 and a minimum distance of 500 samples between consecutive peaks, ensuring that only prominent, well-separated peaks are captured. The detected peaks are then plotted and marked on the waveform using red circles, providing a visual reference for the locations of the key heart sound events. This step is essential for feature extraction and classification, as the timing and prominence of the peaks are critical for analyzing heart sound patterns.
MATLAB CODE
FEATURE EXTRACTION OF HEART SOUND
FEATURE EXTRACTION AND VISUALIZATION OF HEART SOUND
In this step of heart sound analysis, a bandpass IIR filter is designed and applied to the audio signal to isolate key frequency components relevant to heart murmur detection. The filter is configured with an order of 8 and a half-power frequency range of 20 Hz to 600 Hz, effectively targeting the frequency band where heart sounds typically occur. By using zero-phase filtering with the filtfilt
function, the signal is processed without introducing phase distortion, preserving the waveform’s shape. After filtering, the cleaned heart sound signal is plotted against time, providing a clear visual representation of the filtered waveform. This filtered signal can then be used for further feature extraction, such as identifying specific heart sound components like S1, S2, and potential murmurs. The visualization aids in understanding the time-domain characteristics of the heart sounds, which are crucial for feature extraction and classification tasks.
MATLAB CODE
INTRODUCTION
HEART MURMUR
OUR PROJECT
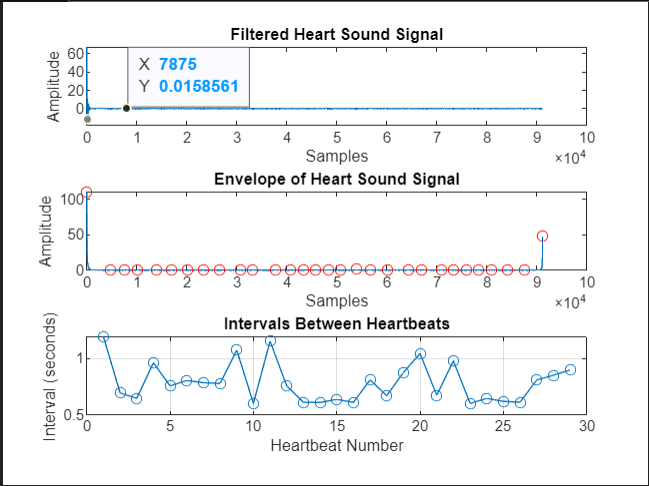
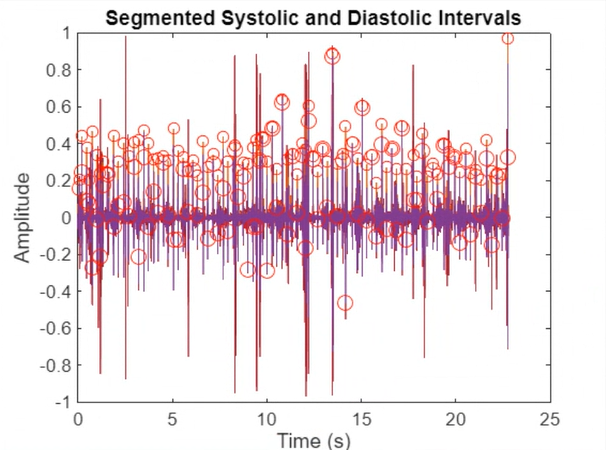
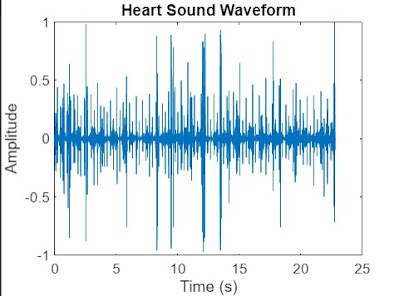
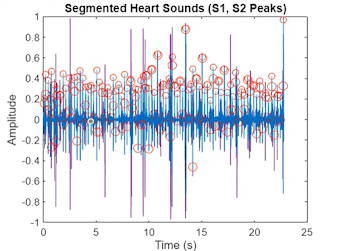
This project focuses on the analysis and detection of heart murmurs and arrhythmias using heart sound signals. Audio data, captured via a stethoscope (e.g., 14998_MV.wav), undergo preprocessing with band-pass filtering (20–1500 Hz) to remove noise. The signal’s envelope is extracted using the Hilbert transform, followed by peak detection to identify S1 and S2 sounds, segmenting the heart cycle into systolic and diastolic intervals.
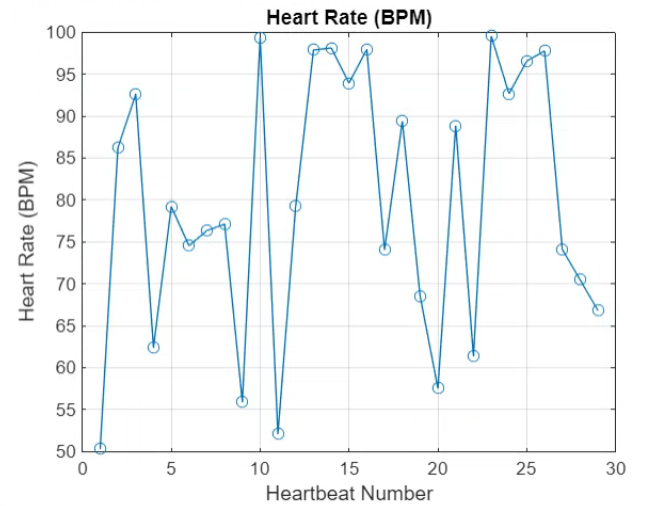
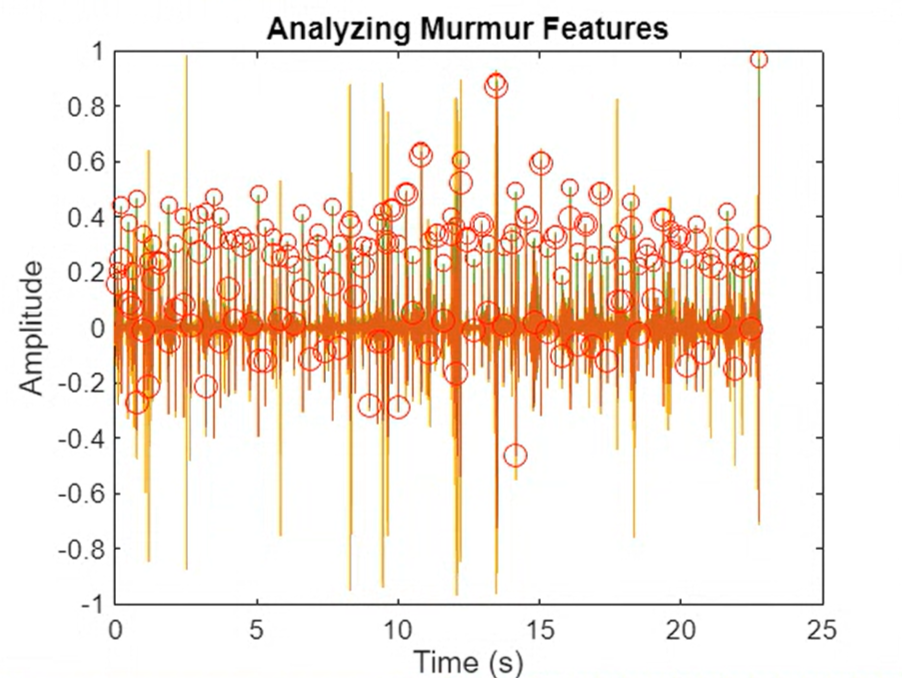
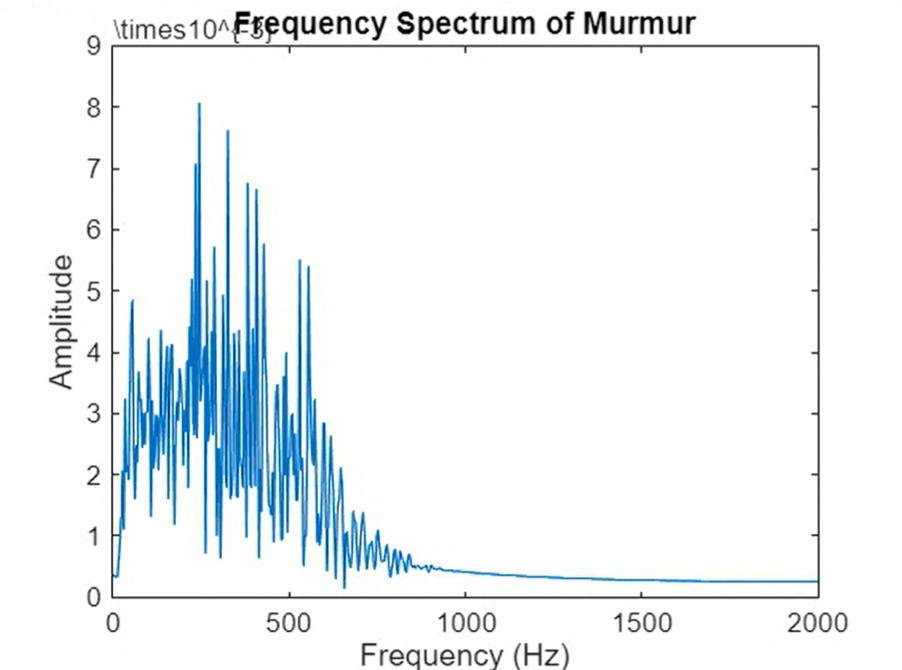
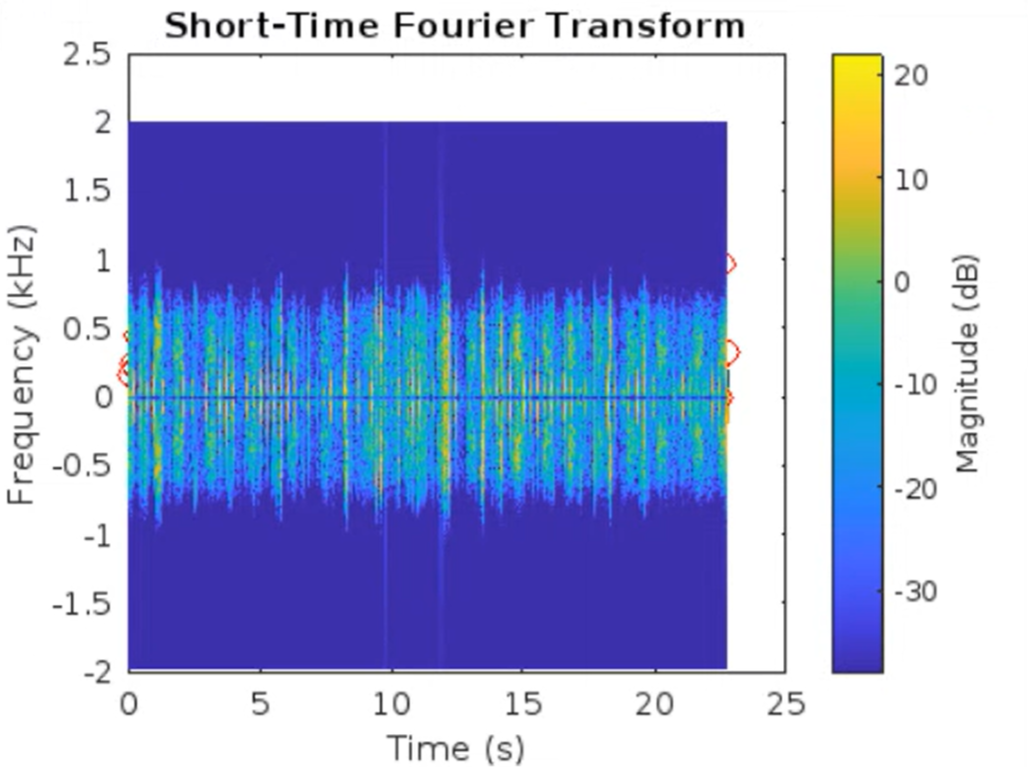
Heart rate is estimated from peak intervals, and murmurs are identified based on abnormal frequency patterns. Additionally, the system detects arrhythmias such as bradycardia, tachycardia, atrial fibrillation, and heart block. Time-frequency analysis using Short-Time Fourier Transform (STFT) further aids in visualizing sound characteristics.
This project demonstrates how heart audio recordings, combined with signal processing techniques, can offer early detection of cardiac abnormalities and support future automated diagnostics.
ARRHYTHMIA DETECTION
Arrhythmia detection in the MATLAB code involves analyzing the time intervals between consecutive heartbeats (S1 and S2 peaks) to identify i...

-
FEATURE EXTRACTION AND VISUALIZATION OF HEART SOUND I n this step of heart sound analysis, a bandpass IIR filter is designed and applied to ...
-
SEGMENTED HEART SOUNDS - S1, S2 PEAKS In this step, the filtered heart sound signal is further analyzed by marking and segmenting key compo...
-
In this stage of heart sound analysis, peak detection is performed on the envelope of the filtered heart sound signal. The find peaks func...